Data Visualization Tools
Based on XMapTools 4.5 embedded documentation – Help file version 09.05.2025
This page describes the Data Visualization module, which can be used to display map data in histograms, binary plots, ternary plots and as an RGB composite image.
The Data Visualization module has access to the data selected in the primary menu of XMapTools when it is opened. To change the type of data, close the module and re-open it after selecting different data.
Visualization Modes
The type of plot to be generated can be selected in the Plot section. The following modes are available:
 Histogram – requires a single variable X; a histogram is generated and plotted in the main figure (Fig. 1)
 Binary plot – requires two variables X and Y; a binary plot is generated and plotted in the main figure, as well as a density image. Two histograms, one for each dimension (not shown if low resource mode is active), are plotted as additional figures (Fig. 2)
 RGB – requires three variables X, Y and Z; an RGB composite image is generated and plotted in the main figure, a legend is plotted in an additional figure (Fig. 3)
 Ternary plot – requires three variables X, Y and Z; a ternary plot is generated and plotted in the main plot, three histograms and a density plot (not shown if low resource mode is active) are plotted as additional plots (Fig. 4)
By default, XMapTools generates a binary diagram when the module is opened if at least two variables (maps) are available.
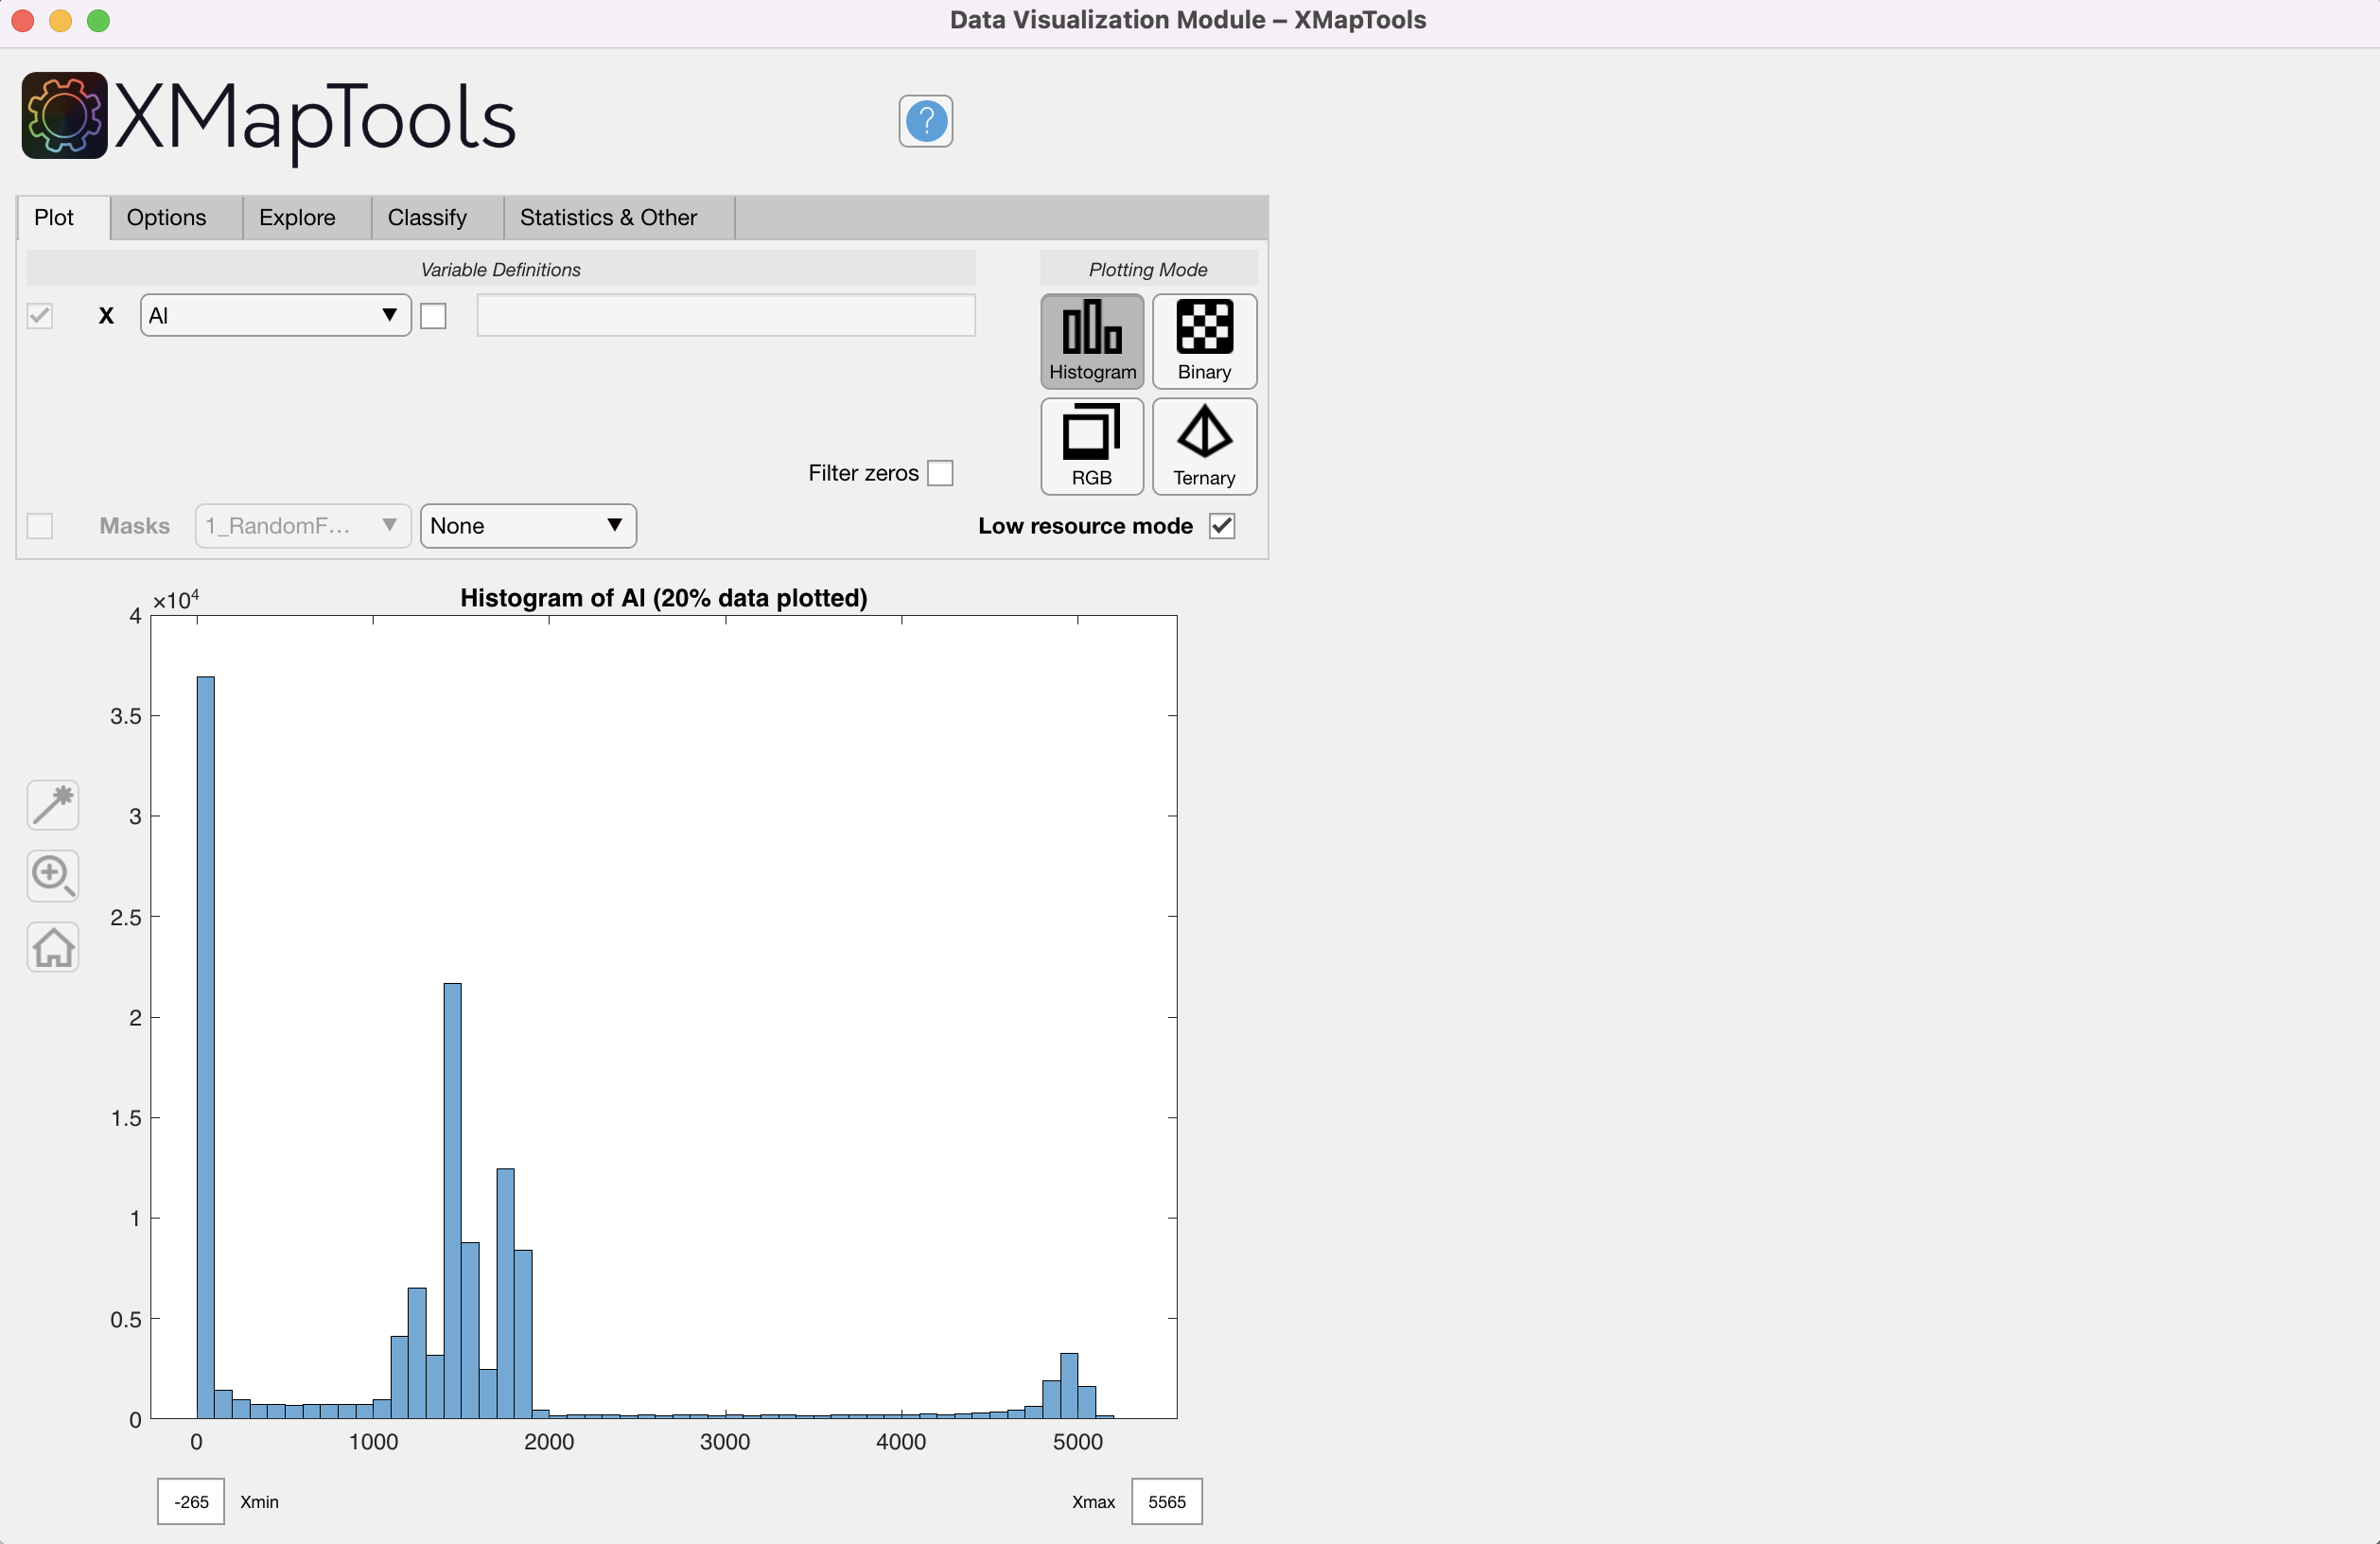
Figure 1: Data Visualization Module, histogram mode.
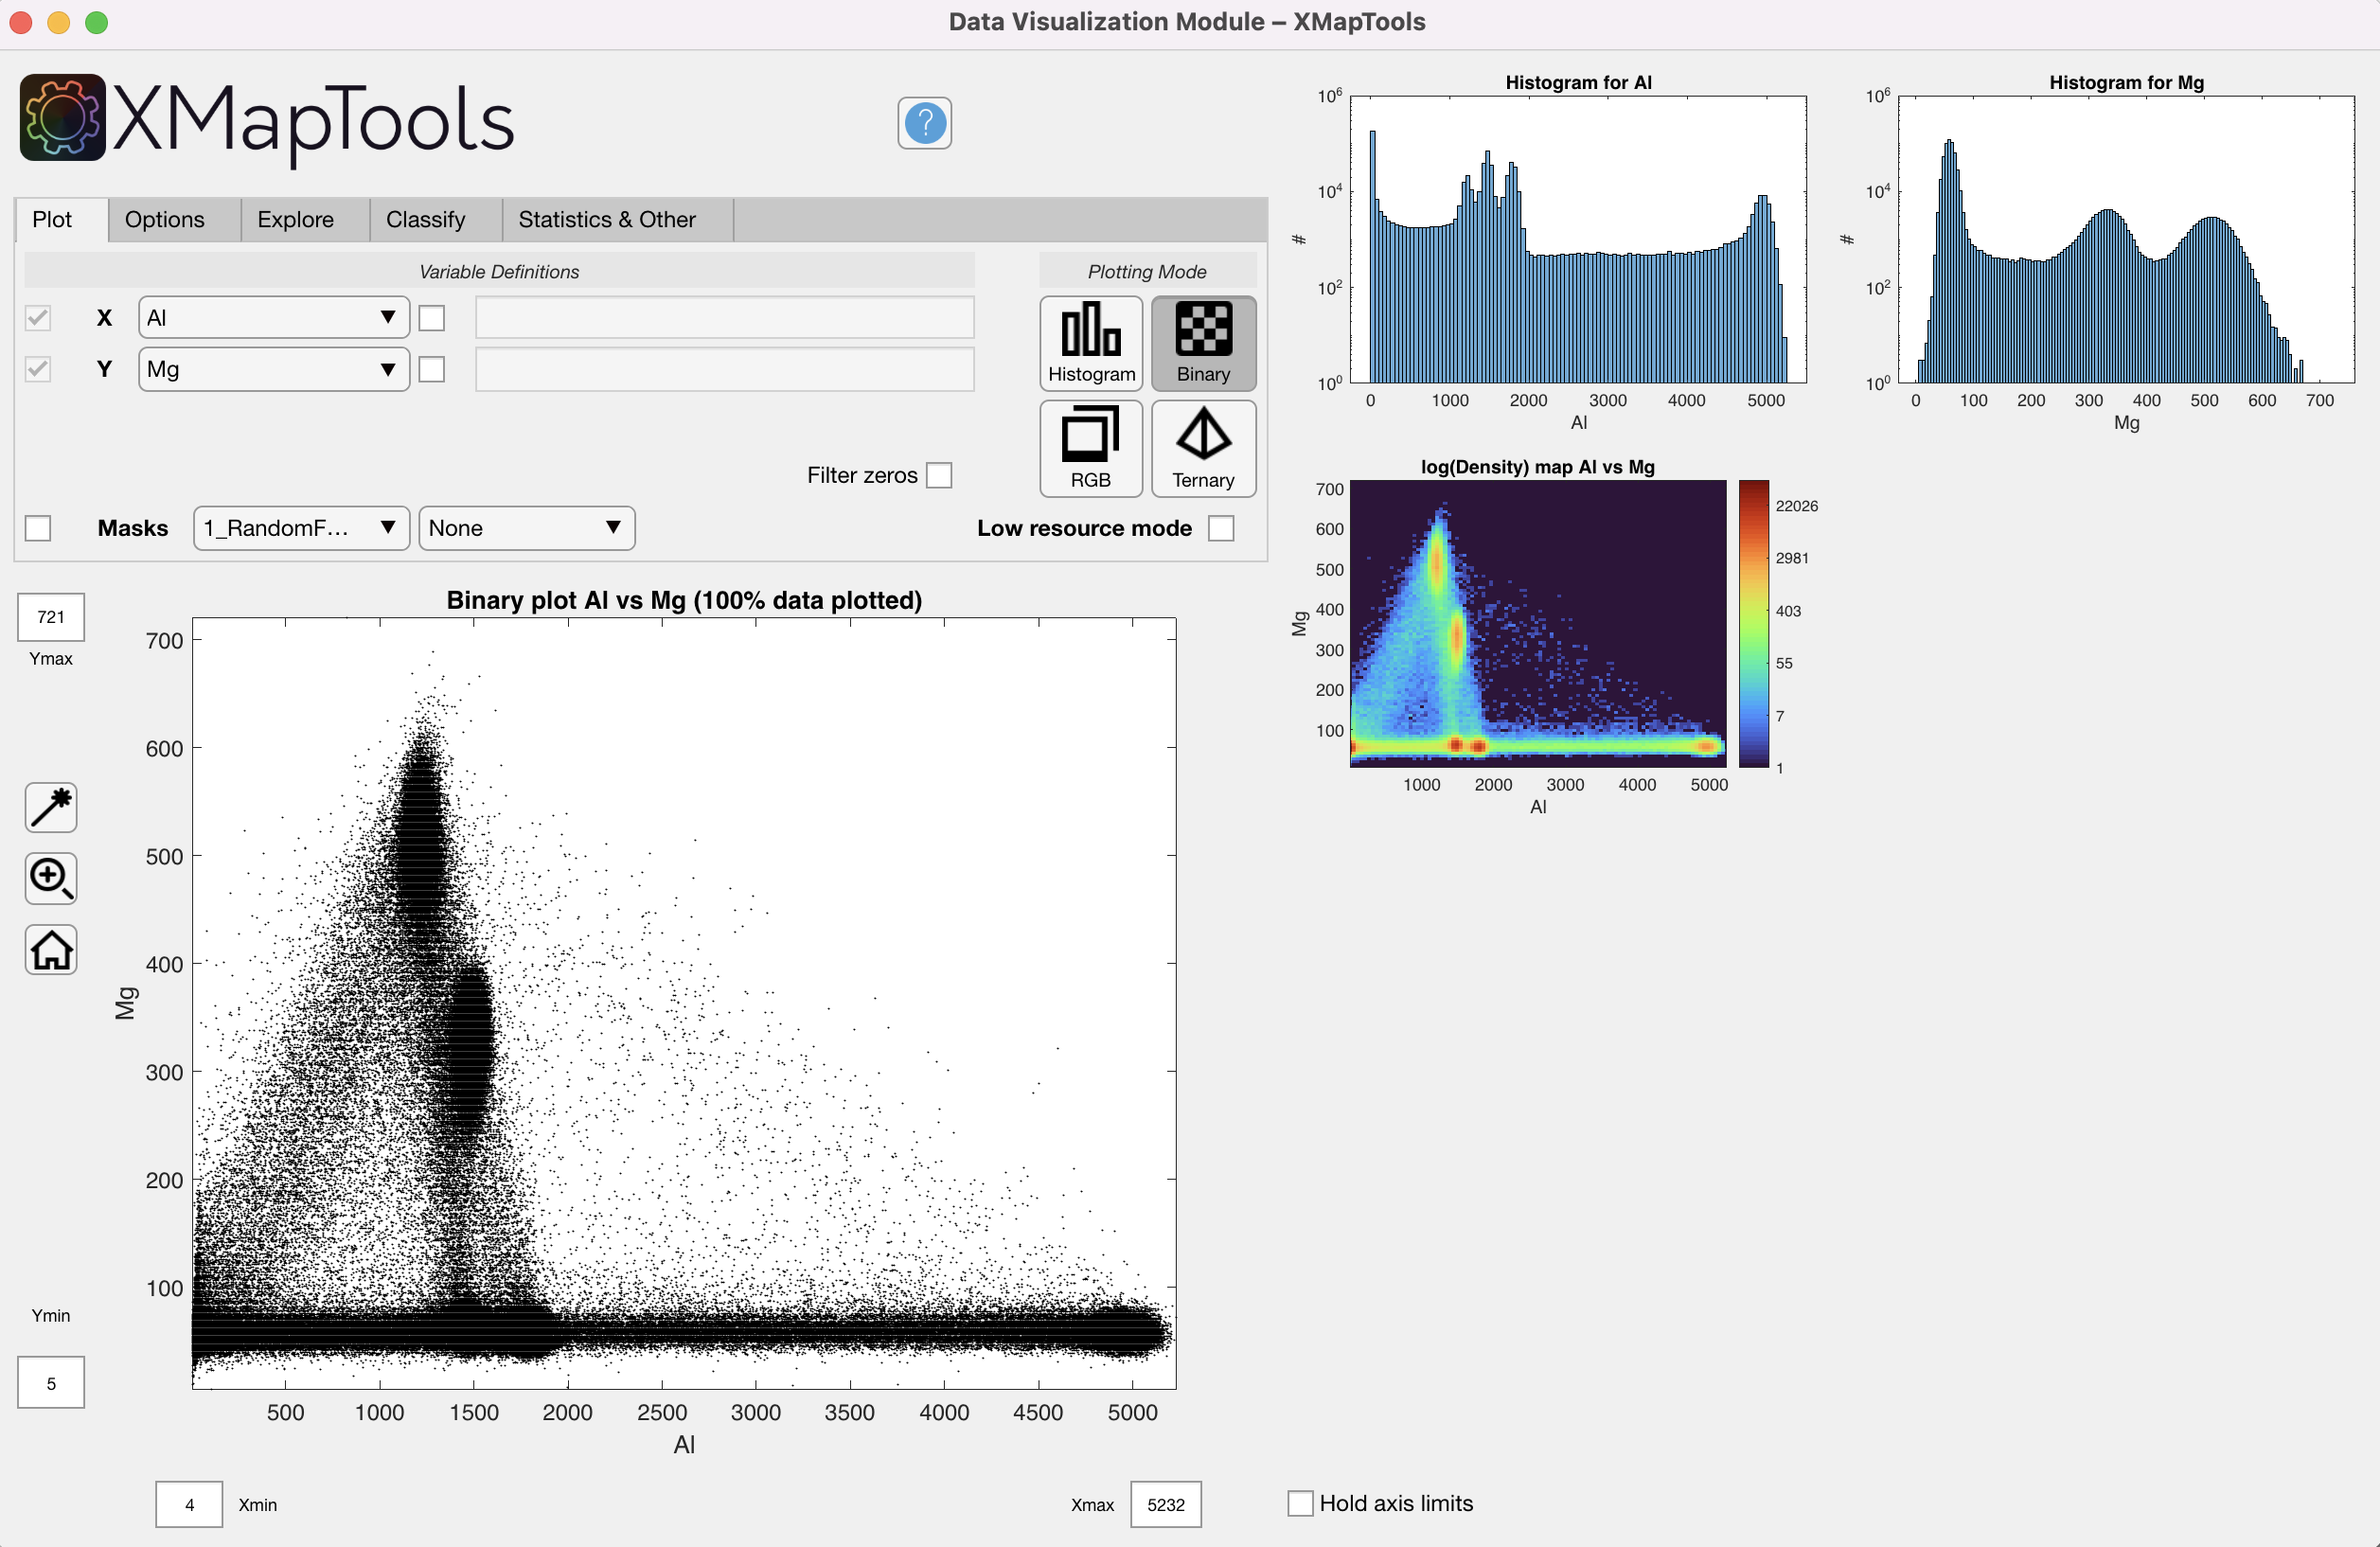
Figure 2: Data Visualization Module, binary mode.
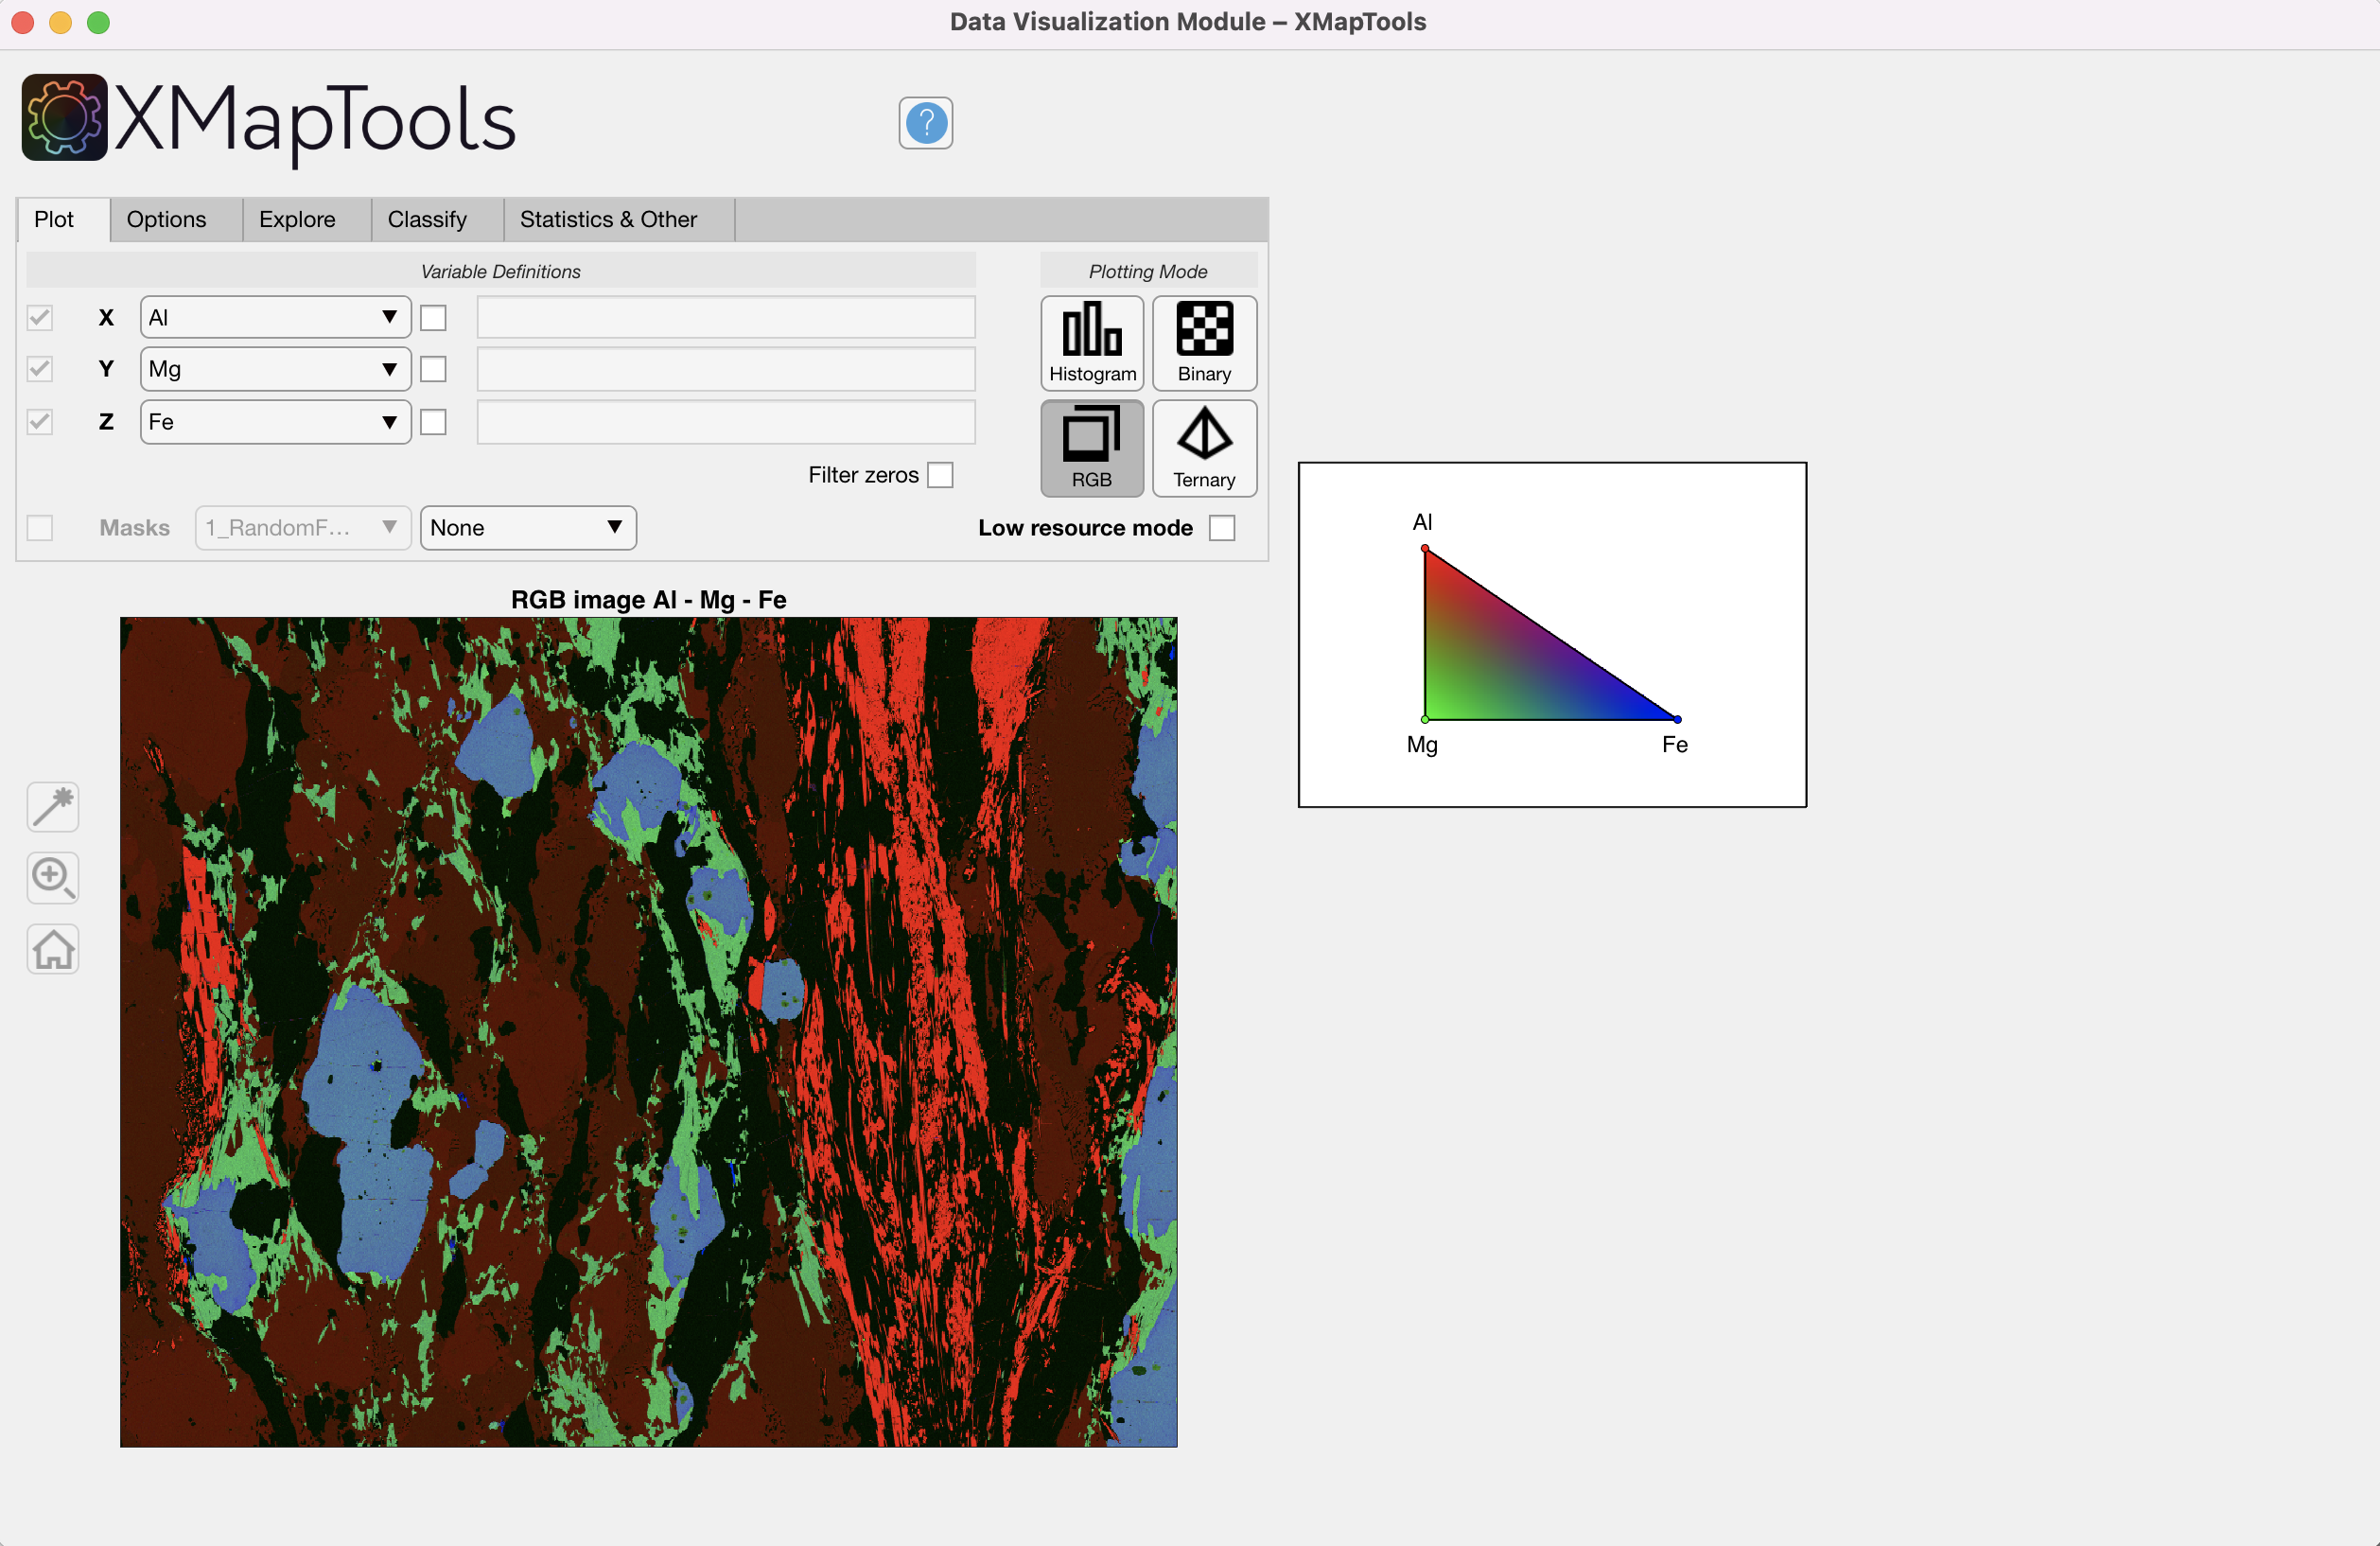
Figure 3: Data Visualization Module, RGB mode.
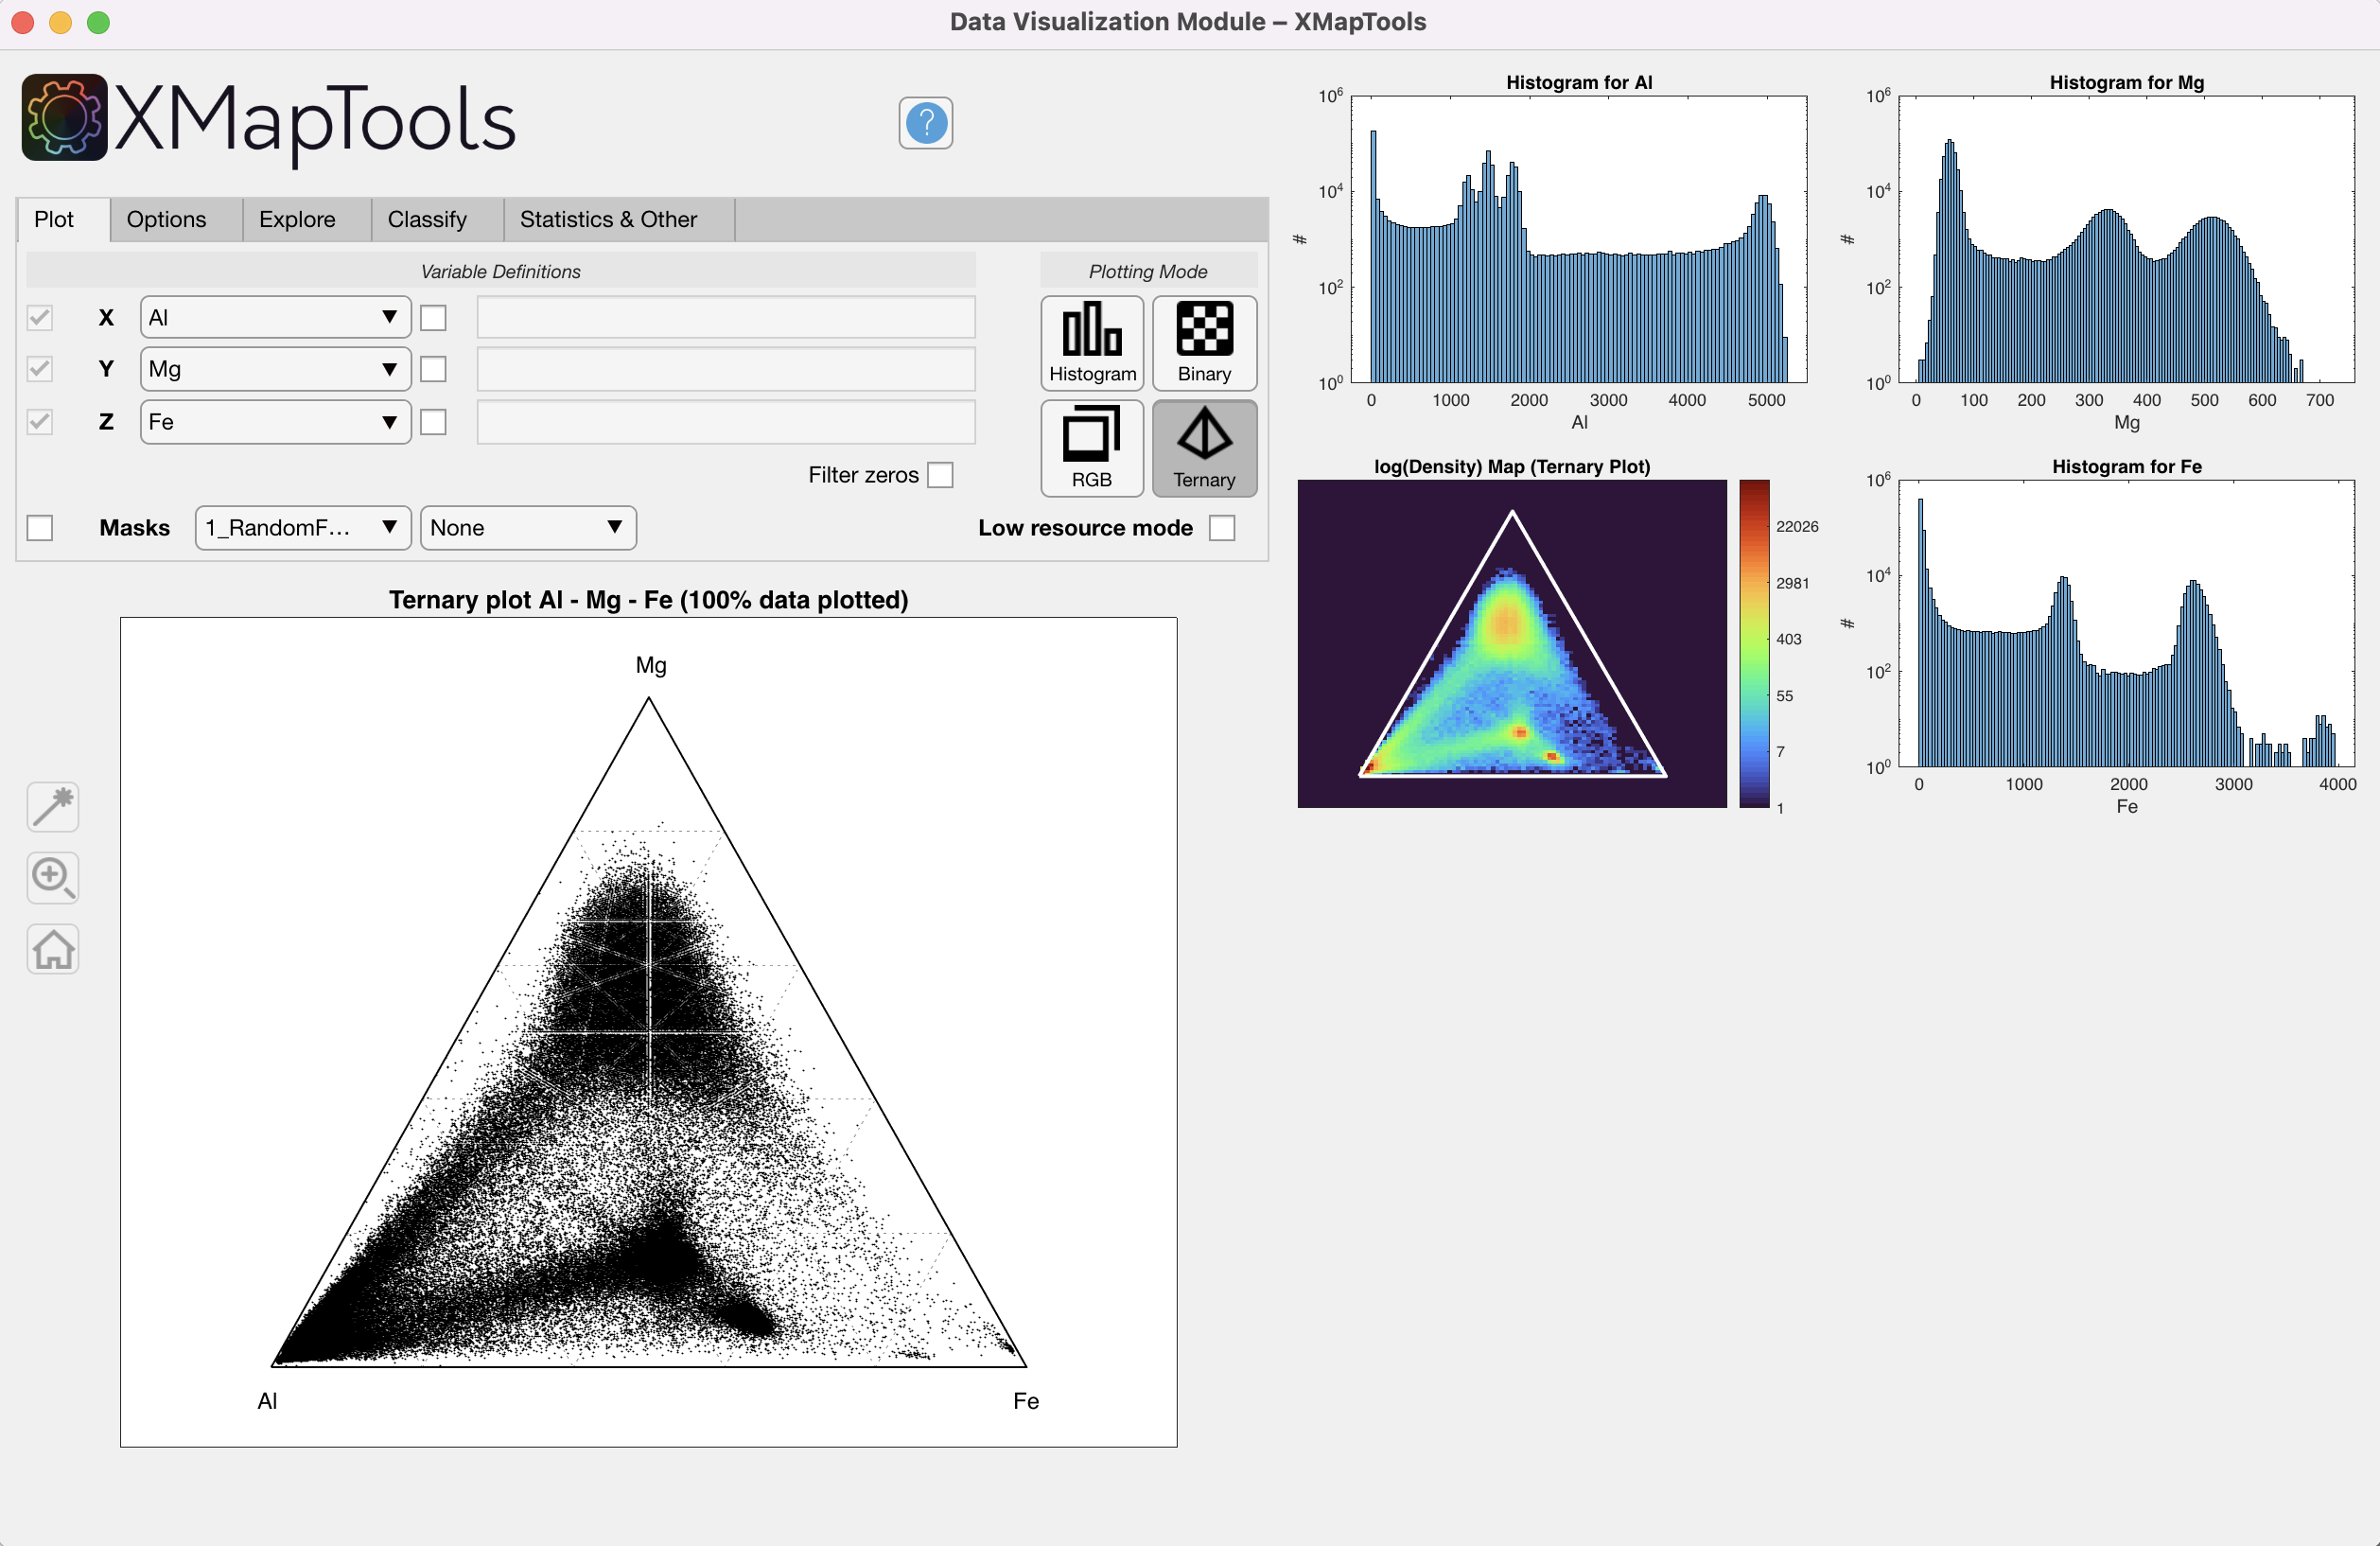
Figure 4: Data Visualization Module, ternary mode.
Variable Definition
On the left hand side of the Plot section you can select the maps to be displayed. These can be elements, groups of elements or any other variable (e.g. structural formula).
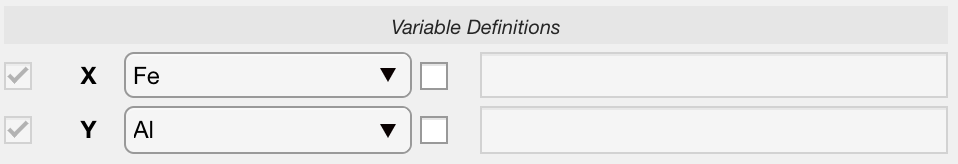
Figure 5: Variable definition.
Whatever the plot type, variables are selected in Variable Definitions, either using the drop-down menus listing all the available maps, or using any combination of them.
Standard MATLAB code format is used to combine existing maps and create new variables to plot. Use an arithmetic operation defined by the rules of linear algebra or array arithmetic. The operation can include spaces between variables, digits, and operators. Array operators (with the dot character ".") must be used when maps are divided or multiplied by each other.
TIP
Element-wise multiplication or division should use .* or ./ to multiply or divide the two arrays element by element.
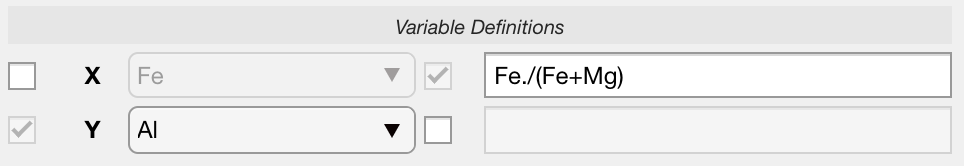
Figure 6: Variable definition using code.
Data Sampling (Explore Section)
A basic pixel identification tool is only available for binary and ternary maps. Use it to create polygons that identify the location of points on the map.
When a polygon is drawn, the pixel locations of all points within the region of interest are displayed on the map at the bottom right. The shape can be edited and the plot updated accordingly. An identical polygon is plotted on the density map when low resource mode is off.
The Polygon ![]() button activates a cross cursor and you can select vertices of a polygon around any region of interest in the main plot. Right-click to close the polygon.
button activates a cross cursor and you can select vertices of a polygon around any region of interest in the main plot. Right-click to close the polygon.
The selection can be saved as a mask file.
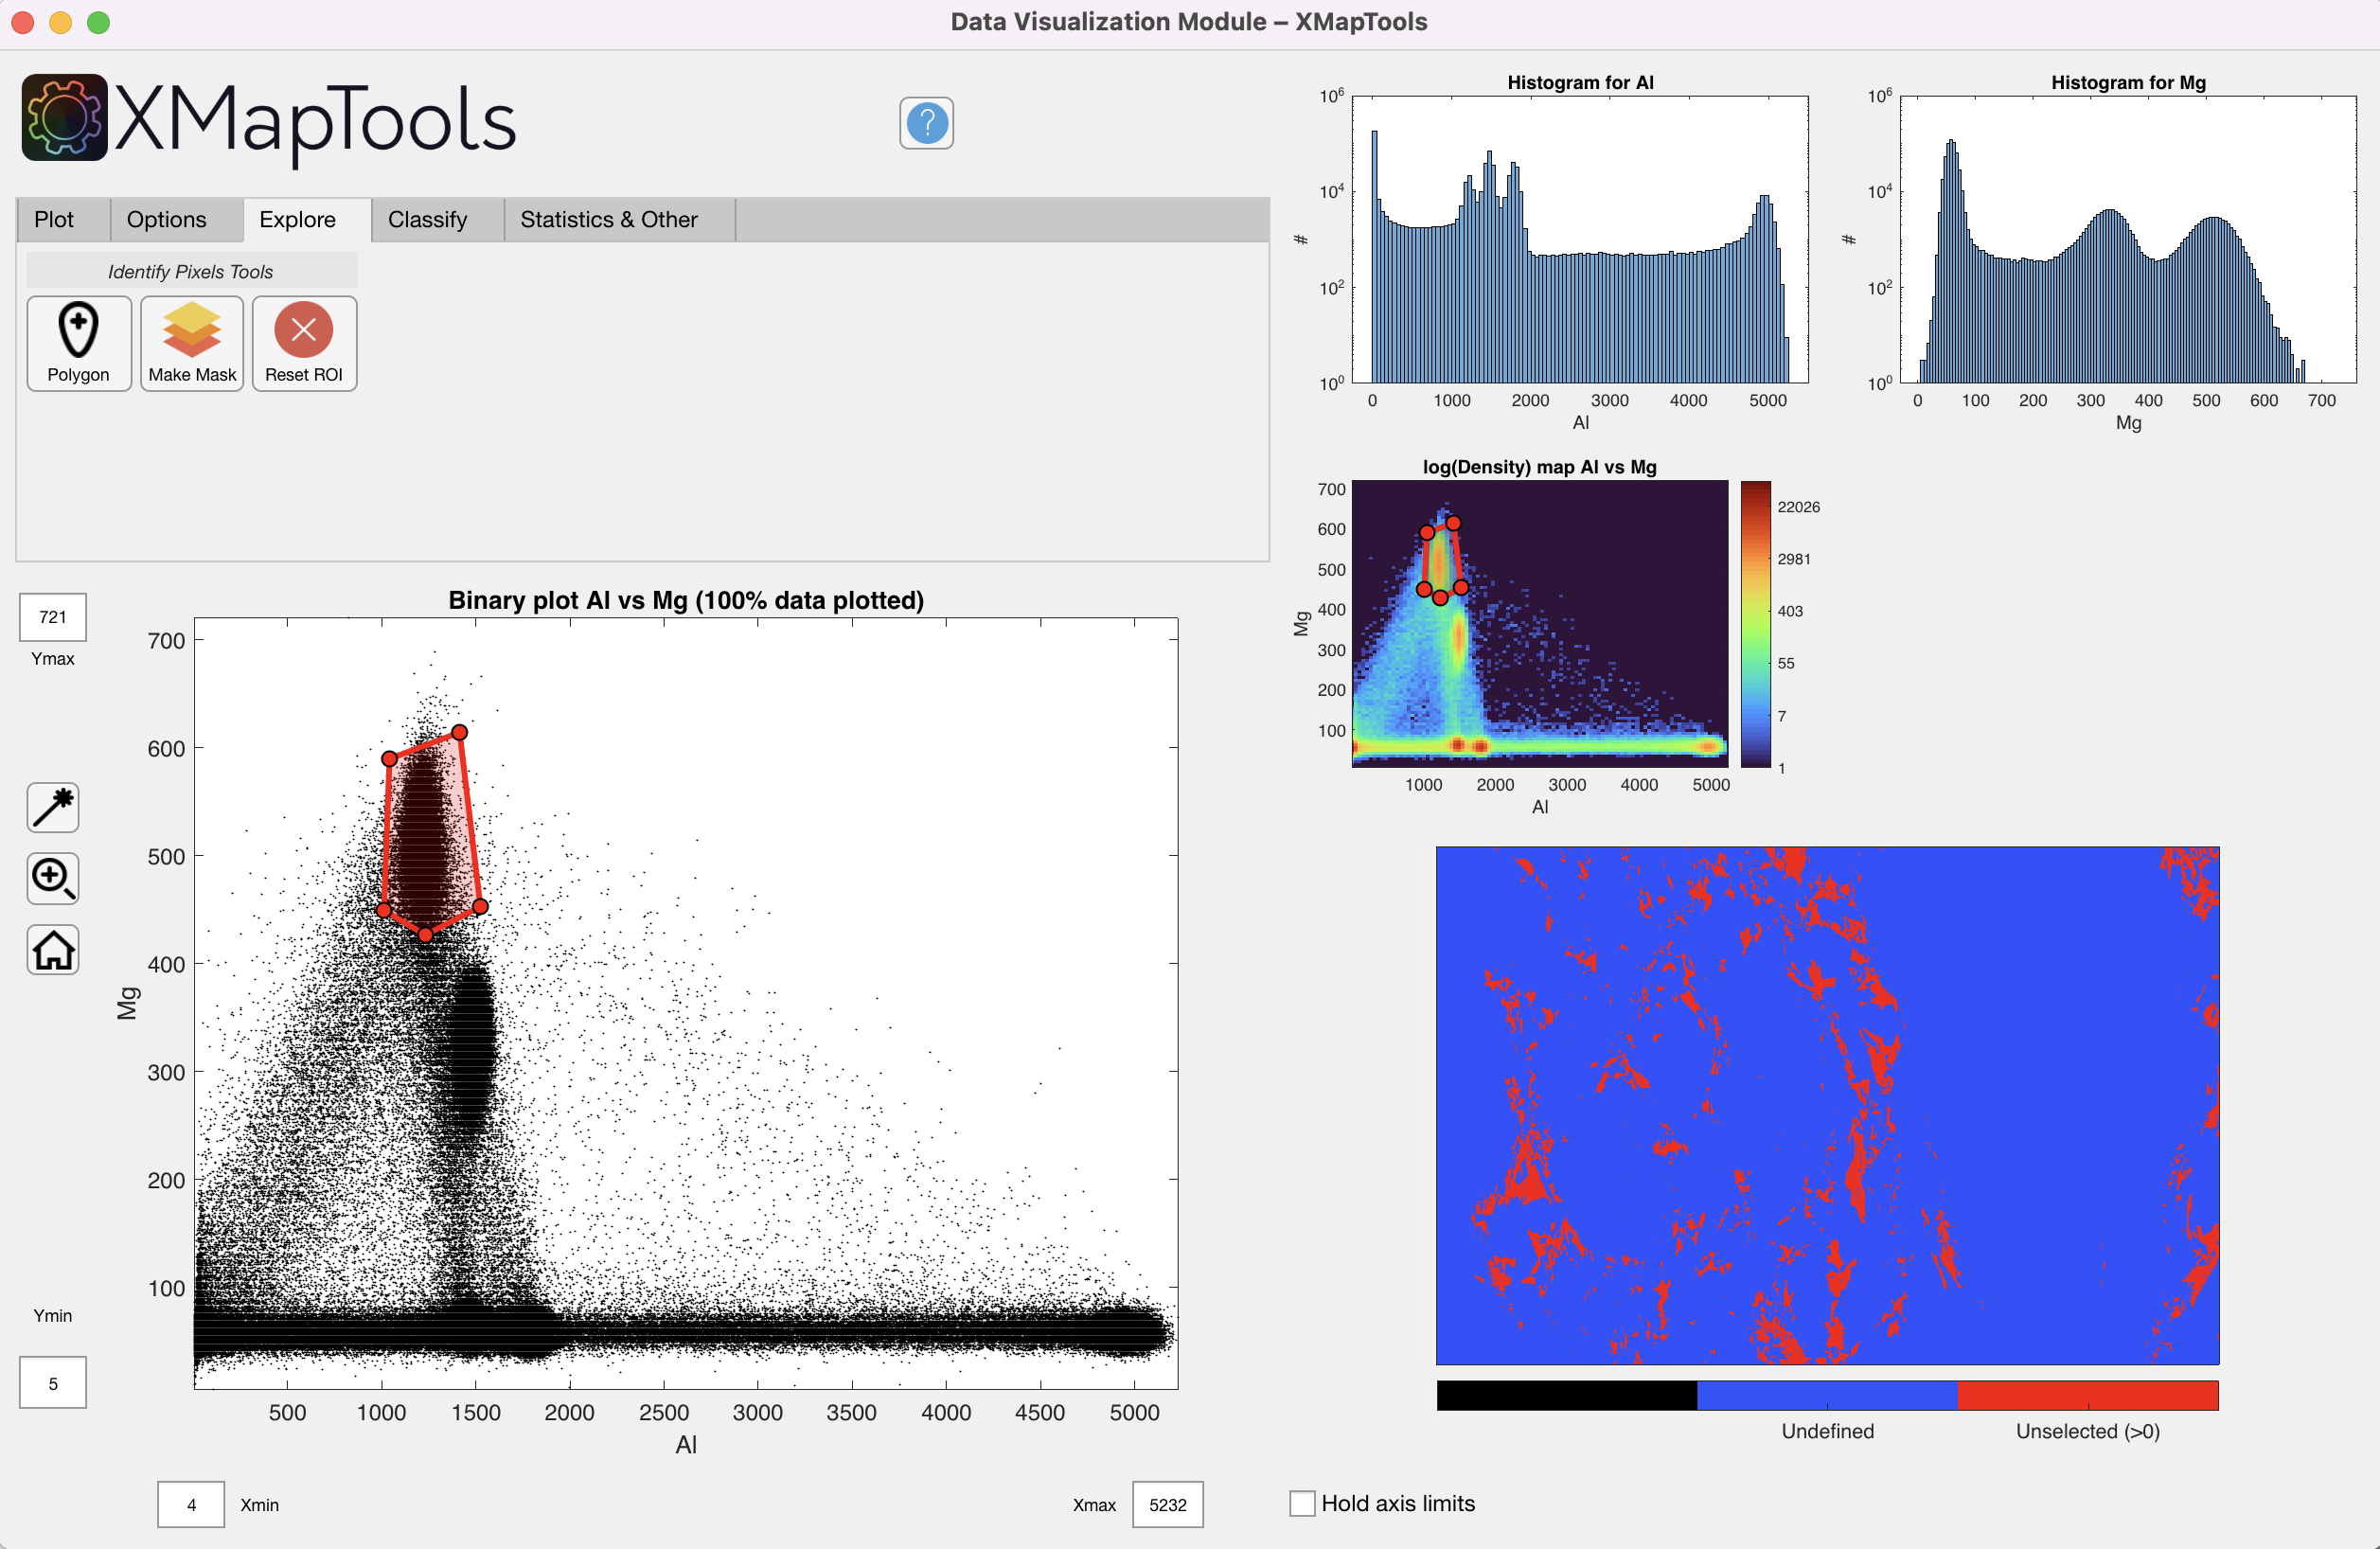
Figure 7: Data Visualization Module — Identify pixels using a polygonal selection in a binary plot.
Options
Masks
![]() Selecting the Masks check box will colour the data displayed in the binary or ternary plots according to the mask file displayed in the drop down menu.
Selecting the Masks check box will colour the data displayed in the binary or ternary plots according to the mask file displayed in the drop down menu.
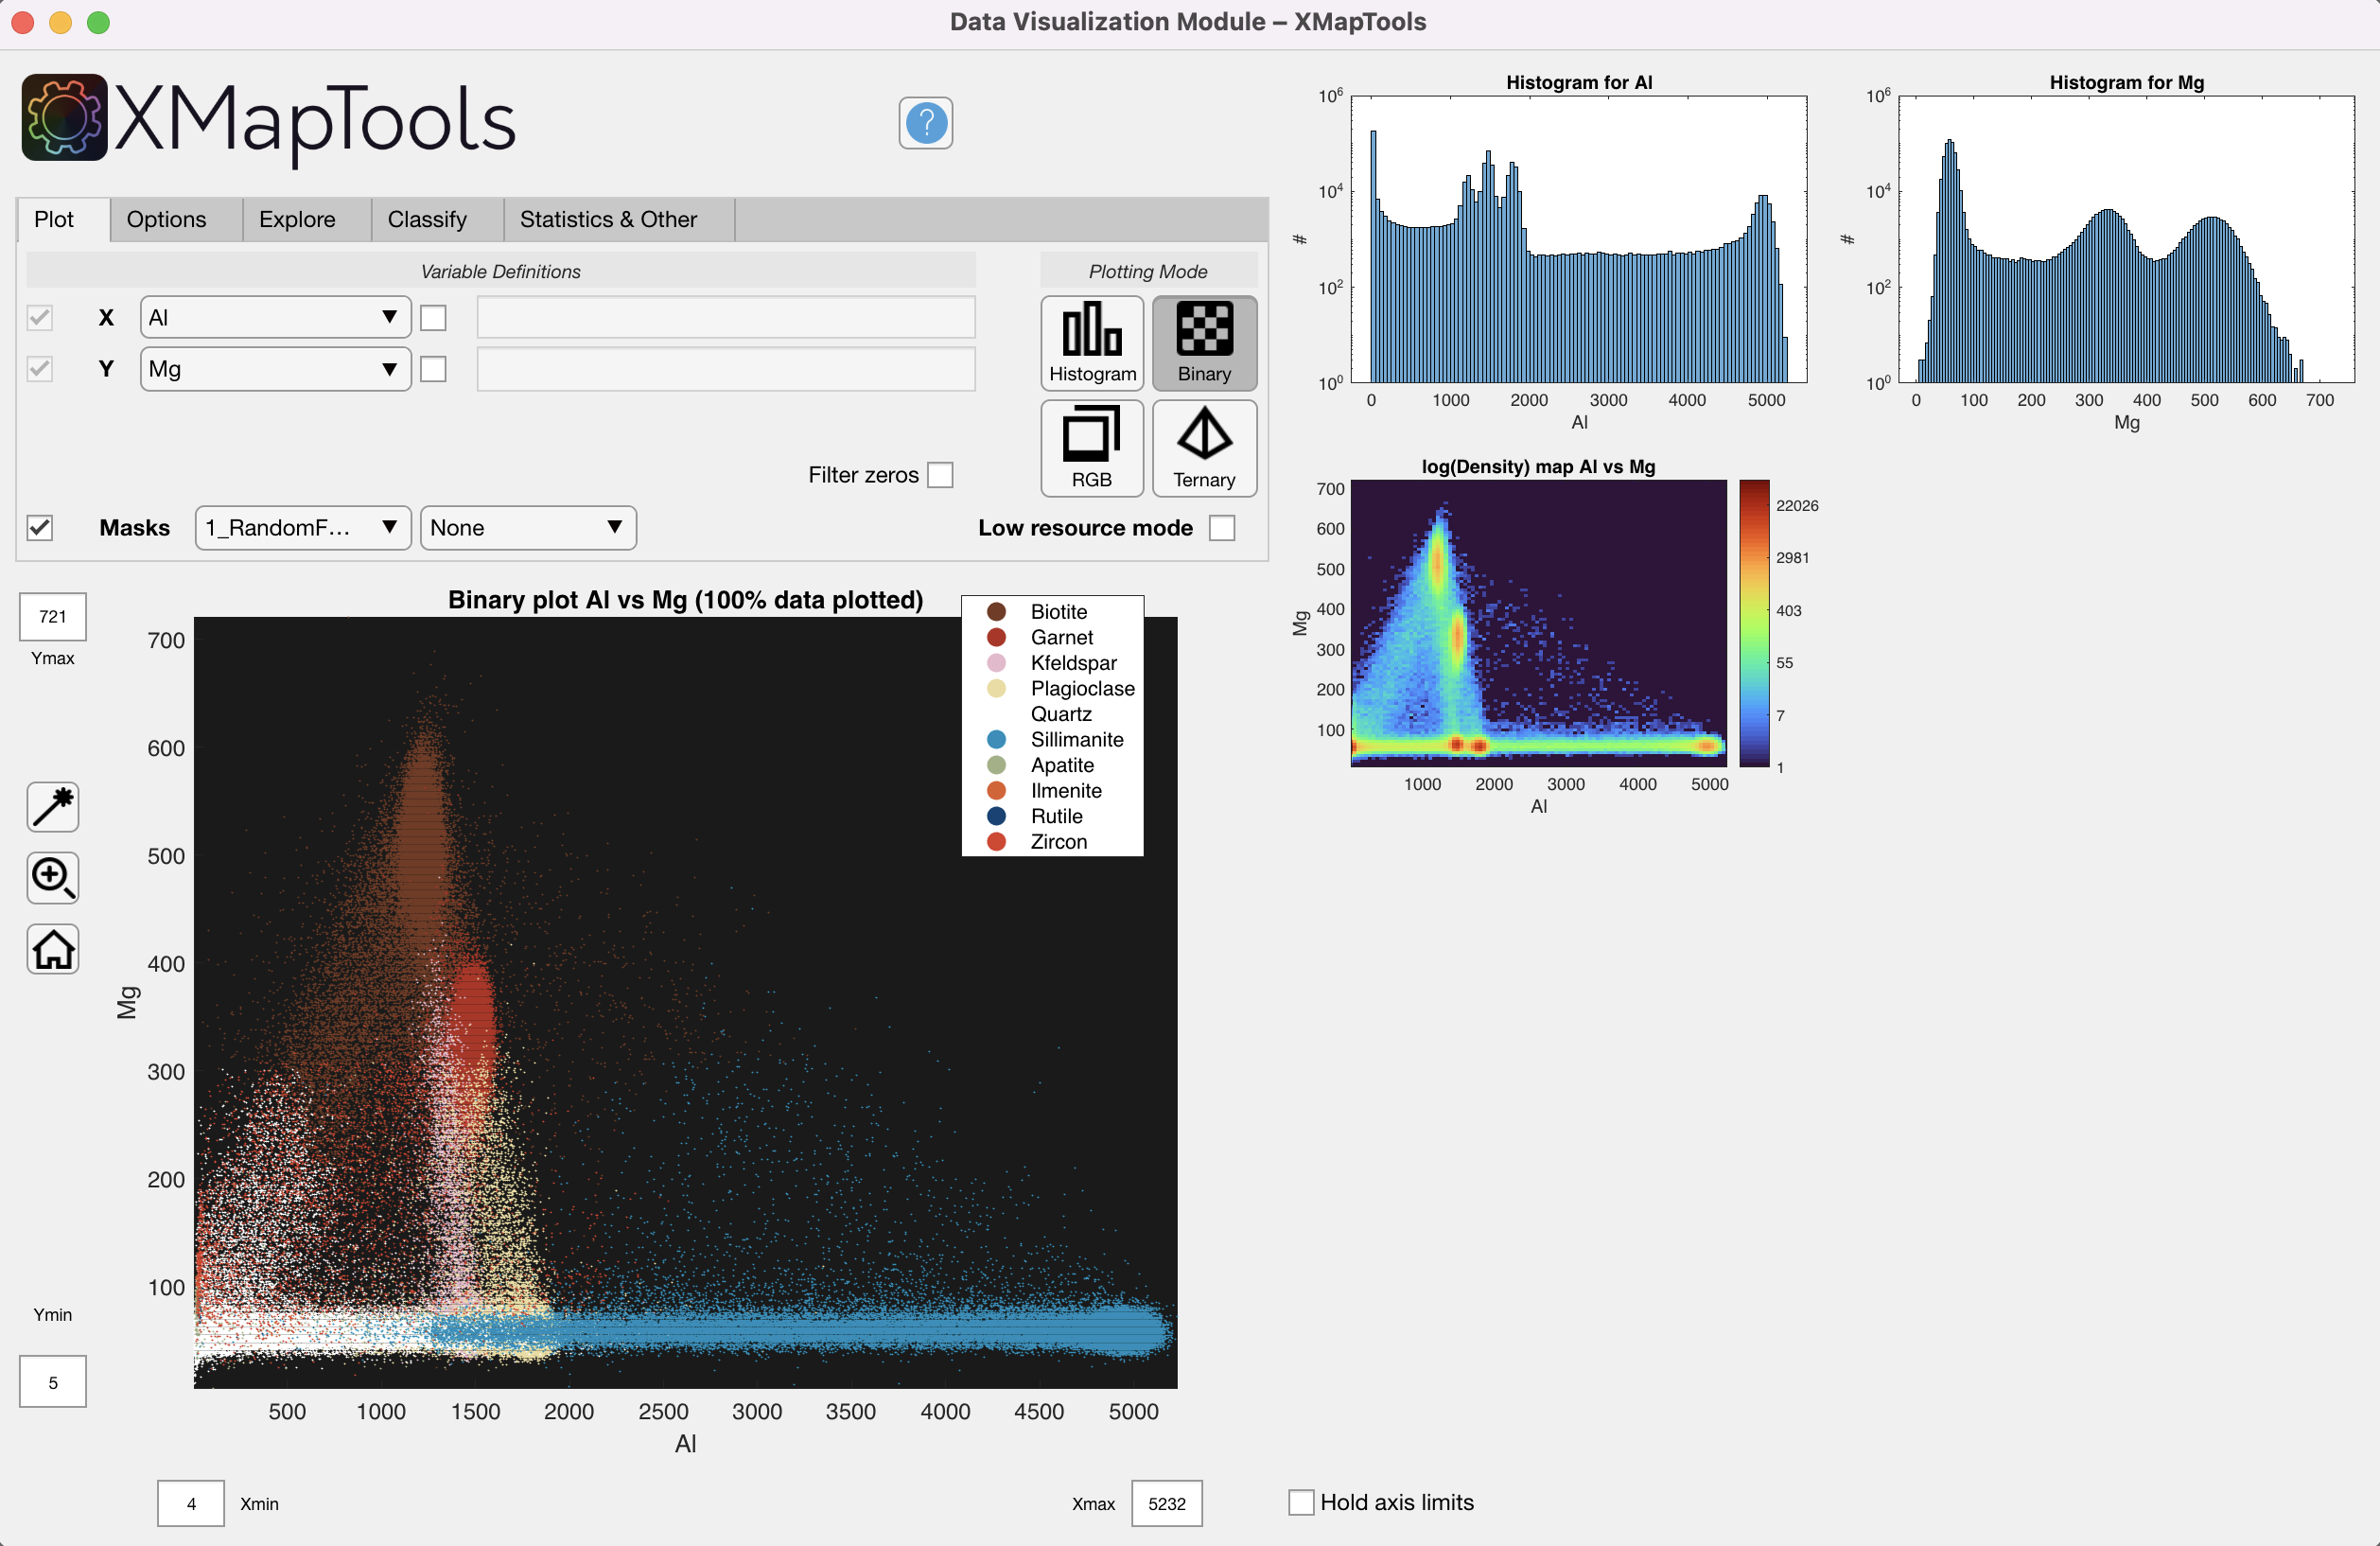
Figure 8: Intensity data coloured according to minerals retrieved from the selected mask file.
Low Resource Mode
This mode is optimal for computers with limited memory and is enabled by default when the Data Visualization module is opened. When this mode is activated, only 40% of the data is plotted (random selection).
Plot "Bulk Value" (Average)
The "Bulk Value" (Average) is calculated from the data plotted in the figure. There is no density correction applied, so deviations from the true bulk composition are expected if phases have different densities.
Statistics and Plotting Report
Statistics are reported in the Statistics section and are updated each time the plot is changed:
- Bulk Value (average of plotted pixels) in binary & ternary plots
- Bulk Value (std of plotted pixels) in binary & ternary plots
- Bulk Value (relative fraction of X, Y and Z) in ternary plots
- Correlation coefficient between X and Y in binary plots
The plotting report section can contain the following information:
- Plot type and Low Resource Mode status
- Size of dataset: number of pixels and fraction displayed
- Various plotting times that can be reported to the developers in case of problems with the module