Images
Based on XMapTools 4.5 embedded documentation – Help file version 14.01.2024
This page describes the Images module, which provides tools to create and manage publication-ready images from XMapTools data.
What are "Image-Data" in XMapTools?
Images are plots stored in the project file and can be accessed from the primary menu under the Image category. These plots can be created using the tools available in the Image menu. They can be edited at any time and changes are saved.
Four types of images can be created:
| Type | Description |
|---|---|
| Single plot image | A single map (e.g. Ca_apfu in garnet) |
| Multi-plot image | A mosaic of maps (e.g. SiO2, Al2O3, FeO, Na2O); can also be combined into a GIF |
| Multi-layer image (shared scale) | Multiple layers plotted with the same colour bar (e.g. XMg in biotite and garnet) |
| Multi-layer image (multi-scale) | Multiple layers, each plotted with its own colour scale and palette |
How to Create and Edit Images
Single-Plot Image
Use the main menu to view a map and, if necessary, adjust the colour contrast using the live histogram. Select Image >> Add Current Image from the main menu. A new image object will be created and placed in the Image category at the bottom of the primary menu.
You can view this image at any time by selecting Img (single-layer) #X from the primary menu (where X is the number of the image).
To edit the image, expand the image object and select the map. You can adjust the colour settings (borders, colour palette, etc.); changes are saved within the image object.
To export the image, select the image item in the primary menu and choose File > Save Image or Edit > Copy Image from the menu.
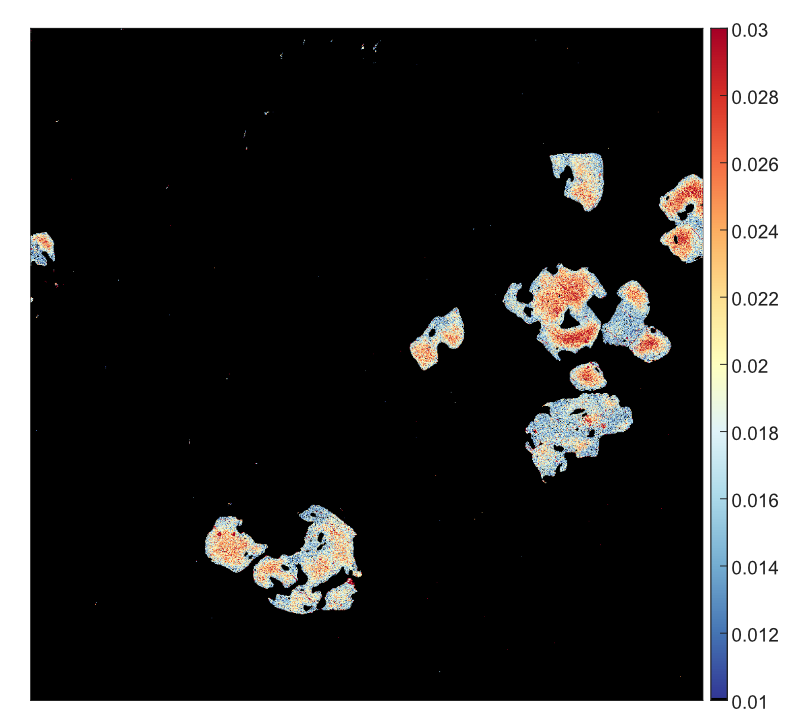
Figure 1: Example of an image generated with XMapTools for Ca (apfu) in garnet.
Multi-Plot Image
- Activate multi-selection mode from the Image > Multi-Selection Mode menu. The item labels in the primary menu are displayed in blue when this mode is active
- Select multiple maps from the primary menu. A mosaic will be created and displayed in the main window
- Select Image > Add Multi-Plot Image from the menu
You can expand the Img (multi-plot) #X item in the primary menu and select the maps one by one to adjust the colour contrast. You can also change the colour palette in the Options panel.
WARNING
It is not recommended to use XMapTools with multi-selection mode enabled for normal operation — it should only be used to generate images.
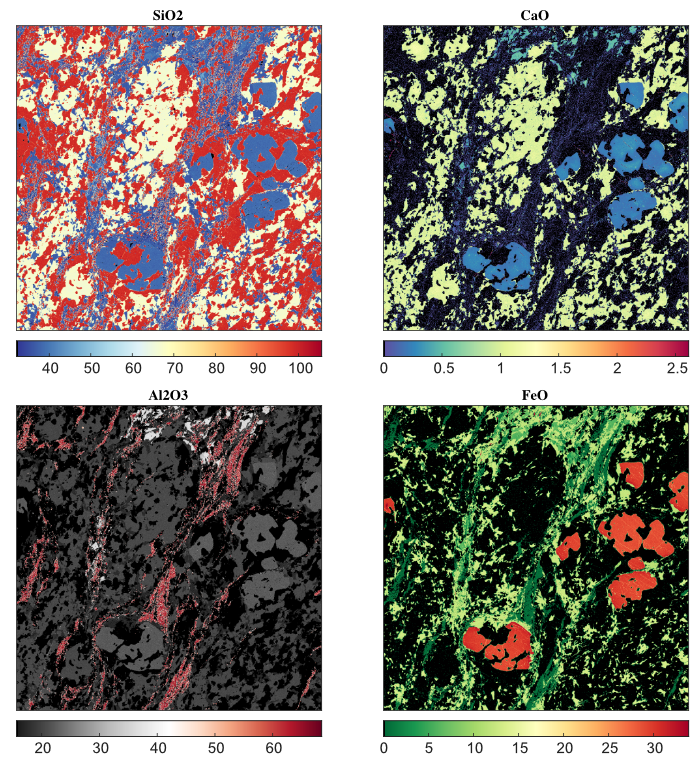
Figure 2: Example of a multi-plot image generated by XMapTools. Maps are expressed in oxide wt%. Note that each map is plotted using a different colour palette.
Multi-Plot Image & GIF
A GIF can be created from a multi-plot image. Select a multi-plot object, right-click on the name and select Save as GIF.
Figure 3: Example of GIF generated with the images shown in Figure 2.
Multi-Layer Image (Shared Scale)
- Activate multi-selection mode from the Image > Multi-Selection Mode menu
- Select two (or more) compatible maps to plot together, for example XMg in biotite and XMg in garnet. The same unit should be used
- Select Image > Add Multi-Layer Image (Shared Scale) from the menu
You can expand the Img (multi-layer ShS) #X item in the primary menu and select the maps one by one to adjust the colour contrast. The same minimum and maximum values are applied to both images.
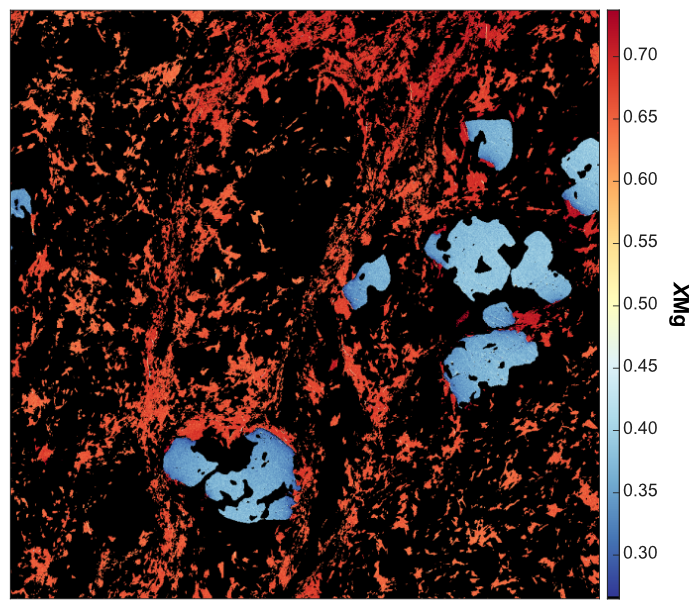
Figure 4: Example of multi-layer image with common colour scale for XMg in garnet and biotite.
Multi-Layer Image (Multi-Scale)
- Activate multi-selection mode from the Image > Multi-Selection Mode menu
- Select two (or more) maps to be plotted together. Different quantities with different scales and units can be selected
- Select Image > Add Multi-Layer Image (Multi-Scale) from the menu
It is strongly recommended to use a different colour map for each map, as multiple colour bars will be created.
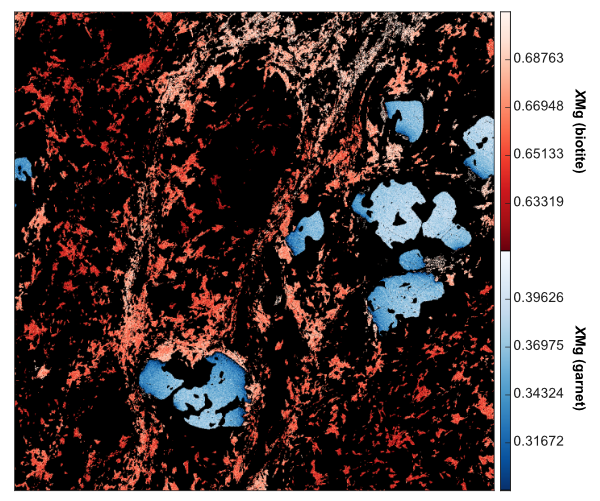
Figure 5: Example of multi-layer image with multi-scale for XMg in garnet and biotite. Note that the contrast is much better than on Figure 4 because two colour bars are used.