Spot Data
Based on XMapTools 4.5 embedded documentation – Help file version 09.02.2026
This page describes the tools available in the Spot Data workspace. This feature was added in XMapTools 4.5.
Datasets and Adding Spots in XMapTools
In XMapTools, spot data is stored in datasets. A dataset is a collection of spot positions, and each position can be linked to external data.
New datasets can be created by selecting the "Spot Dataset" item in the secondary menu and by clicking on the Add ![]() button. New datasets are added to the list of datasets in the secondary menu on the left. The name of the dataset is automatically generated using the name provided in the text field (Fig. 1). A dataset can be renamed by double-clicking on its name in the list. To delete a dataset, first select it in the list, then right-click on its name and select Delete.
button. New datasets are added to the list of datasets in the secondary menu on the left. The name of the dataset is automatically generated using the name provided in the text field (Fig. 1). A dataset can be renamed by double-clicking on its name in the list. To delete a dataset, first select it in the list, then right-click on its name and select Delete.
Spots can be automatically added while creating a dataset if the Randomly populate option is selected. In this case the number of spots and their names is defined in the Nb and Spot Name fields. Spots are automatically distributed using the display image and only the pixels with a value between Cmin and Cmax. This allows users to select one mask/submask or a specific composition of the map.
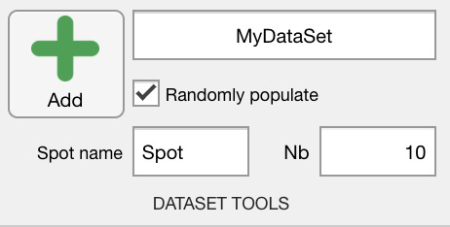
Figure 1: Dataset tools for spot data in XMapTools 4.5.
Spot integration
Each spot corresponds to a set of X,Y coordinates, but the compositional data can be extracted from taking the median and MAD values of the surrounding pixels. If the Integrate Pixels option is activated, the compositional data is extracted by integrating the values of the surrounding pixels. The number of pixels to be integrated is defined in the Nb x Nb fields corresponding to the number of pixels along X and Y directions. These two numbers must be odd to ensure that the central pixel is included in the integration.
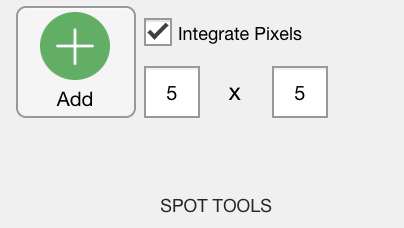
Figure 2: Spot tools for spot data in XMapTools 4.5.
Adding and editing spots
Additional spots can be added by pressing the Add Spot ![]() button and by immediately clicking on the map to define the spot position. The spots can be deleted by selecting them in the secondary menu and then by right-clicking on their name and selecting Delete. The position of the spots can be edited by selecting their name in the list and dragging them on the map. The coordinates of the spots are automatically updated.
button and by immediately clicking on the map to define the spot position. The spots can be deleted by selecting them in the secondary menu and then by right-clicking on their name and selecting Delete. The position of the spots can be edited by selecting their name in the list and dragging them on the map. The coordinates of the spots are automatically updated.
In the example reported in Figure 3 below, 10 spots were automatically added to the newly created dataset 'Garnet'. The default names were used for the spots (Spot_#). The compositional data of the spots are extracted by integrating the values of the surrounding pixels in a 5x5 grid (Nb = 25). Note that the spot coordinates are available in a table on the right of the interface when the dataset garnet is selected (Fig. 3).

Figure 3: Spot data interface in XMapTools 4.5.
If a spot is selected in the secondary menu, the names, coordinates and value of each pixel are listed in the table on the right of the interface. The compositional data of the spot is extracted by taking the median and MAD values of the surrounding pixels. You can delete pixels by selecting them in the table and by pressing the Delete button. You can reset to the original n×n grid of pixels by pressing the Reset button.
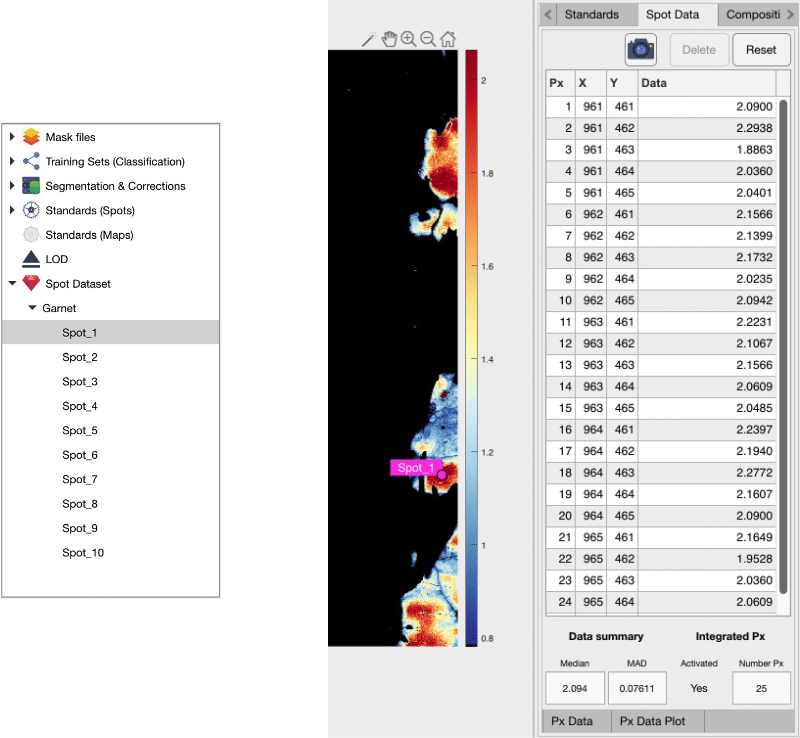
Figure 4: Spot data pixel details in XMapTools 4.5.
Importing External Data for Spots
External data for the spots can be imported and visualised in XMapTools. The following procedure is recommended:
- Select a Spot dataset in the secondary menu. The list of spots will be displayed in the table on the right (Fig. 3)
- Use the Copy
 button to copy the content of the table to the clipboard
 - Paste the content of the clipboard in a spreadsheet software (e.g., Excel) and add the compositional data for each spot in new columns after the name
- Save the Excel file as a CSV file
Import the spot external data by using the Import ![]() button available in the Spot External Data section (Fig. 5). The number of columns in the CSV file (except the name column) corresponds to the number of variables that will be imported and visualised in XMapTools (e.g. one variable in Fig. 5). You can use the display button to open a table containing the spot names and external values. The external data can be visualised on the map by selecting the variable to be displayed in the Add to plot dropdown menu in the Plot external data section.
button available in the Spot External Data section (Fig. 5). The number of columns in the CSV file (except the name column) corresponds to the number of variables that will be imported and visualised in XMapTools (e.g. one variable in Fig. 5). You can use the display button to open a table containing the spot names and external values. The external data can be visualised on the map by selecting the variable to be displayed in the Add to plot dropdown menu in the Plot external data section.
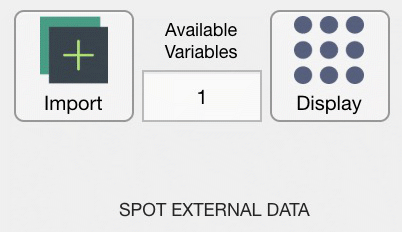
Figure 5: Spot External Data tools in XMapTools 4.5.
Two options Apply a colour gradient and Apply spot size gradient can be selected in the Plot external data section (e.g. colour gradient for Fig. 6).
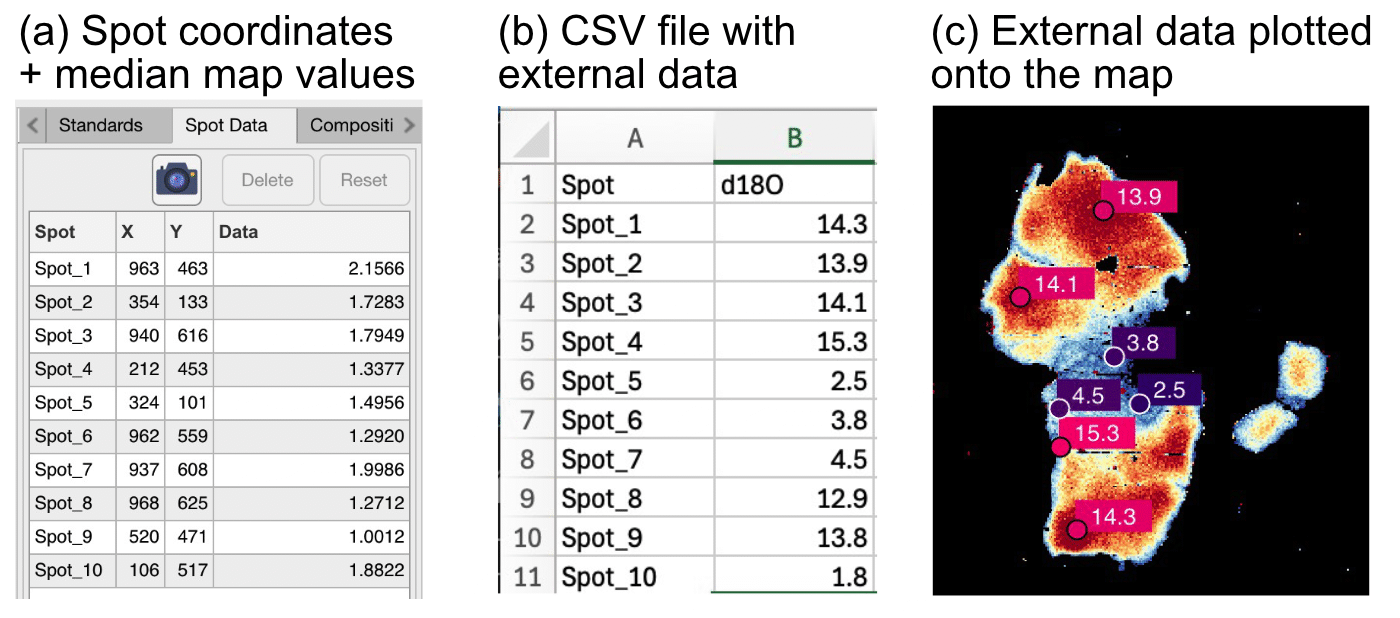
Figure 6: Example of (a) spot data in XMapTools, (b) external data for δ18O saved in a CSV file, (c) external spot data (δ18O) plotted onto the map.
Exporting Spot Data
Spot data can be exported using the Export module available in the Add-on section. Open the module and select the Export Spot Data mode. Select your data source (e.g. Quanti in Fig. 7) and press the Generate & Save button.
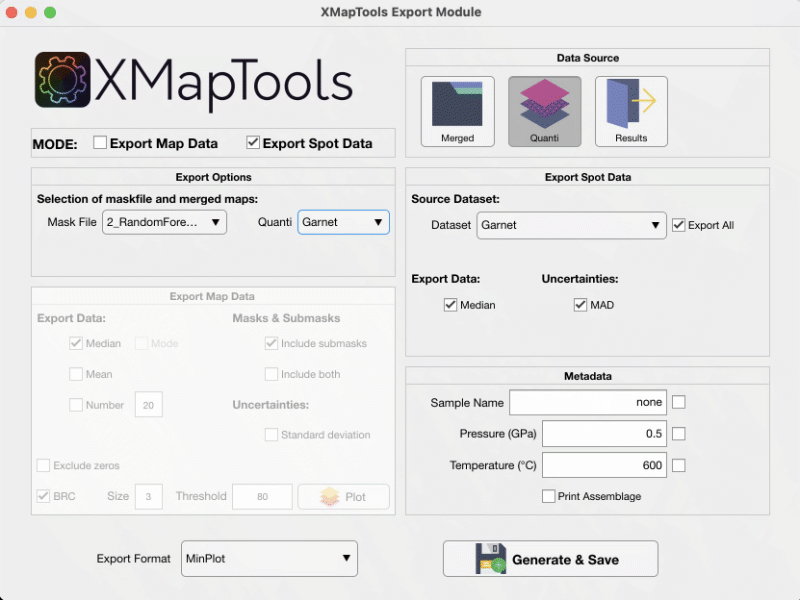
Figure 7: Export module for Spot Data in XMapTools 4.5.